Profiles
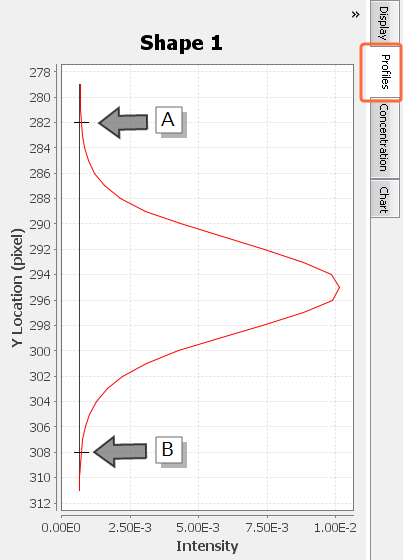
The Profiles tab displays a graph of Pixel Intensity vs Location for a selected shape or lane. This graph can be helpful to visually correlate band brightness with pixel intensity peaks.
The Profiles tab can be used to:
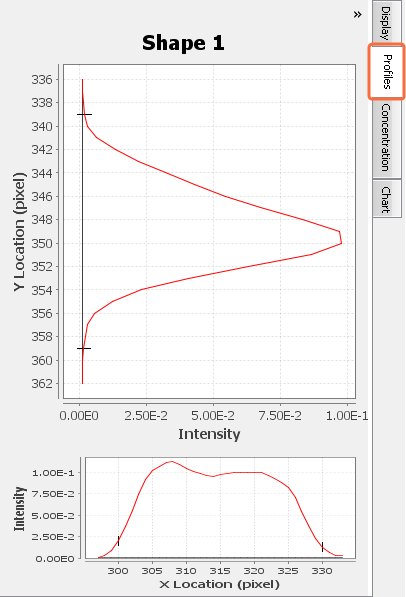
- See if a shape overlaps multiple bands
- Inspect the pixel intensity profile throughout a lane
To display the Pixel Intensity vs Location graph for a shape or lane...
- Select the shape or lane in the image.
-
Click the Profiles tab on the right side of the Image Studio Software window.
The Profiles tab will open to show a graph with Pixel Intensity on the x-axis and pixel Position on the y-axis.