Analysis Table
On a page where an Analysis Table is available, click Analysis Table  to view quantification data and other values (the values in the Analysis Table vary between pages in the software).
This page provides tips for using the Analysis Table.
Viewing Data
Click this button above a table to add or remove columns from the table.
Exporting Data
Click this button above a table to export the columns currently included in the table to an Excel spreadsheet or a CSV file.
Adjust Column Width
Hover the mouse between two column headers. The cursor will become a double-sided arrow . Click and drag to adjust the width of the columns.
View Value Calculations
Hover the mouse over the header of a column to see how the value was calculated.
Sort
Click a column header to sort the data in the table by the values in that column.
-
Click a column a second time to reverse the sort order.
-
You can sort by more than one column. Hold SHIFT while clicking a second column header to sort by the second column. The column with the first sort priority will be indicated with a triangle and circle icon with a single circle (e.g.
 ). The column with the second sort priority will be indicated with a triangle and circle icon with two circles (e.g.
  ).
).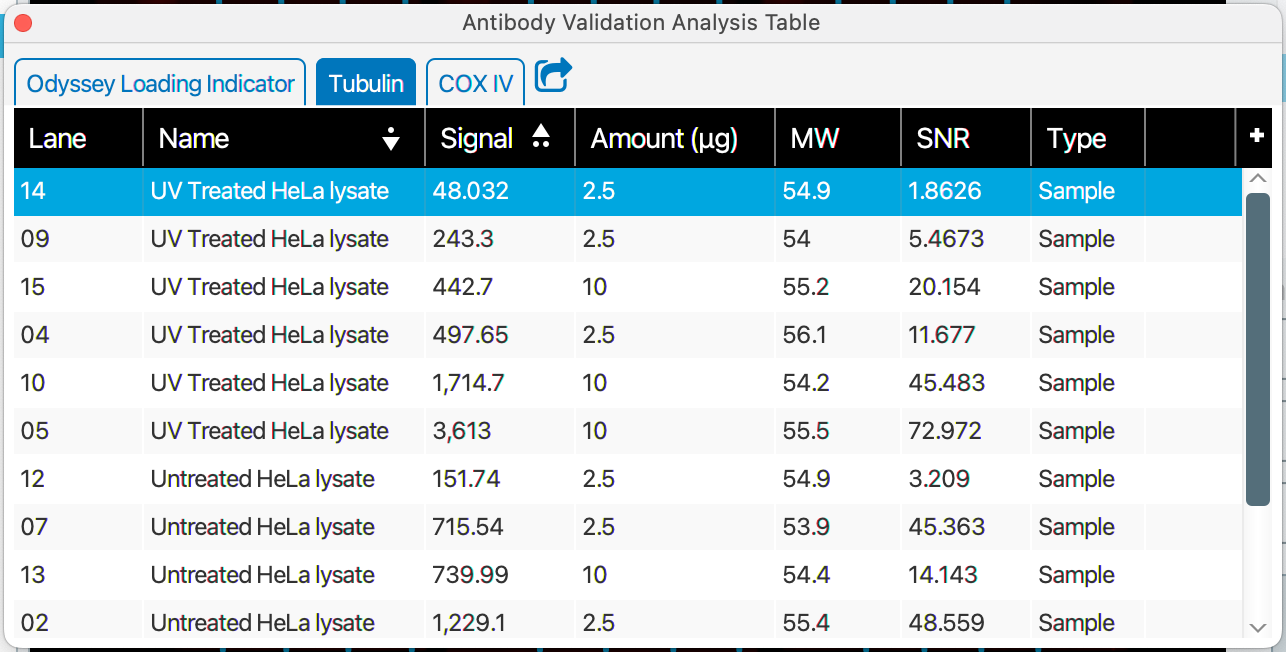
This image shows a sorted Analysis Table. The list has been sorted first by the Name column and then by the Signal column. -
More than two sort levels are possible.